Creating visualization or widget
-
Select a workbook to visualize data. You can choose one of the following types of workbooks:
-
Workspace workbooks: Regular workbooks added directly to your workspace.
-
BI workbooks: Specialized workbooks designed for Business Intelligence use cases.
For more details refer to BI Workbooks.
Do the following to select a workbook:
- On the Home page, from the left navigation panel, click Workspace.
- From the list of available workspaces, select a workspace.
- At the top, click Visualizer.
- Choose the required workbook from the list.
-
-
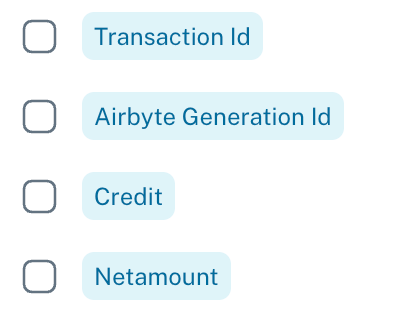
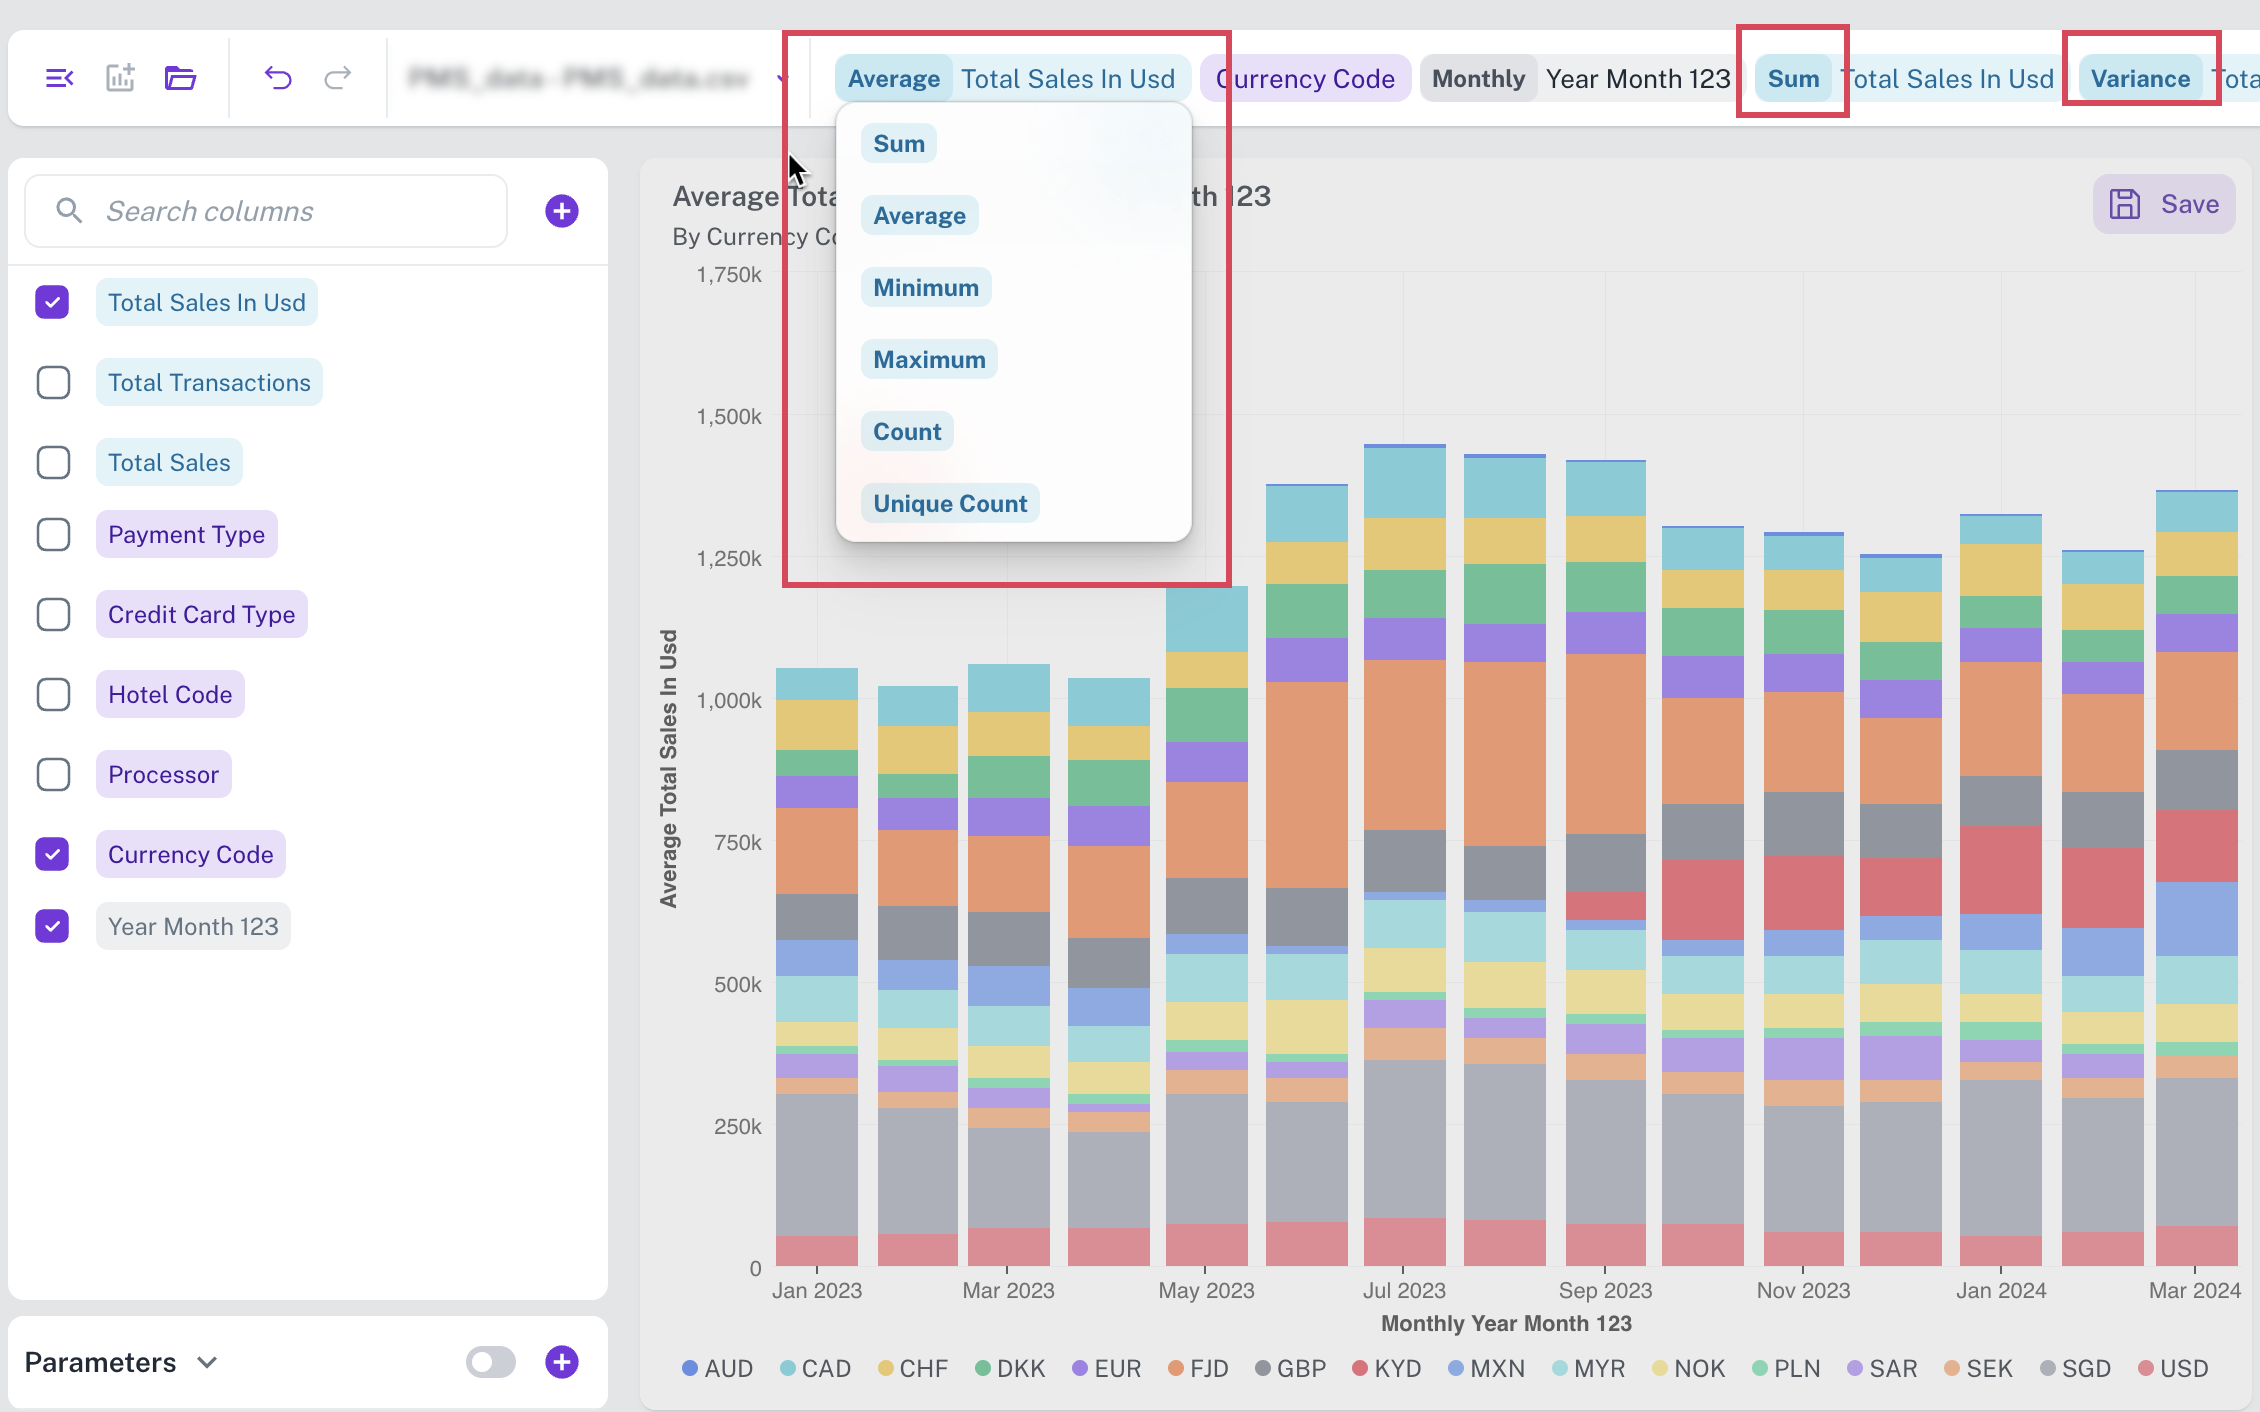
Add columns to visualize. All the columns of the workbook are listed in the left navigation panel. Select the columns from the left navigation panel, which also gets populated on the Search bar.
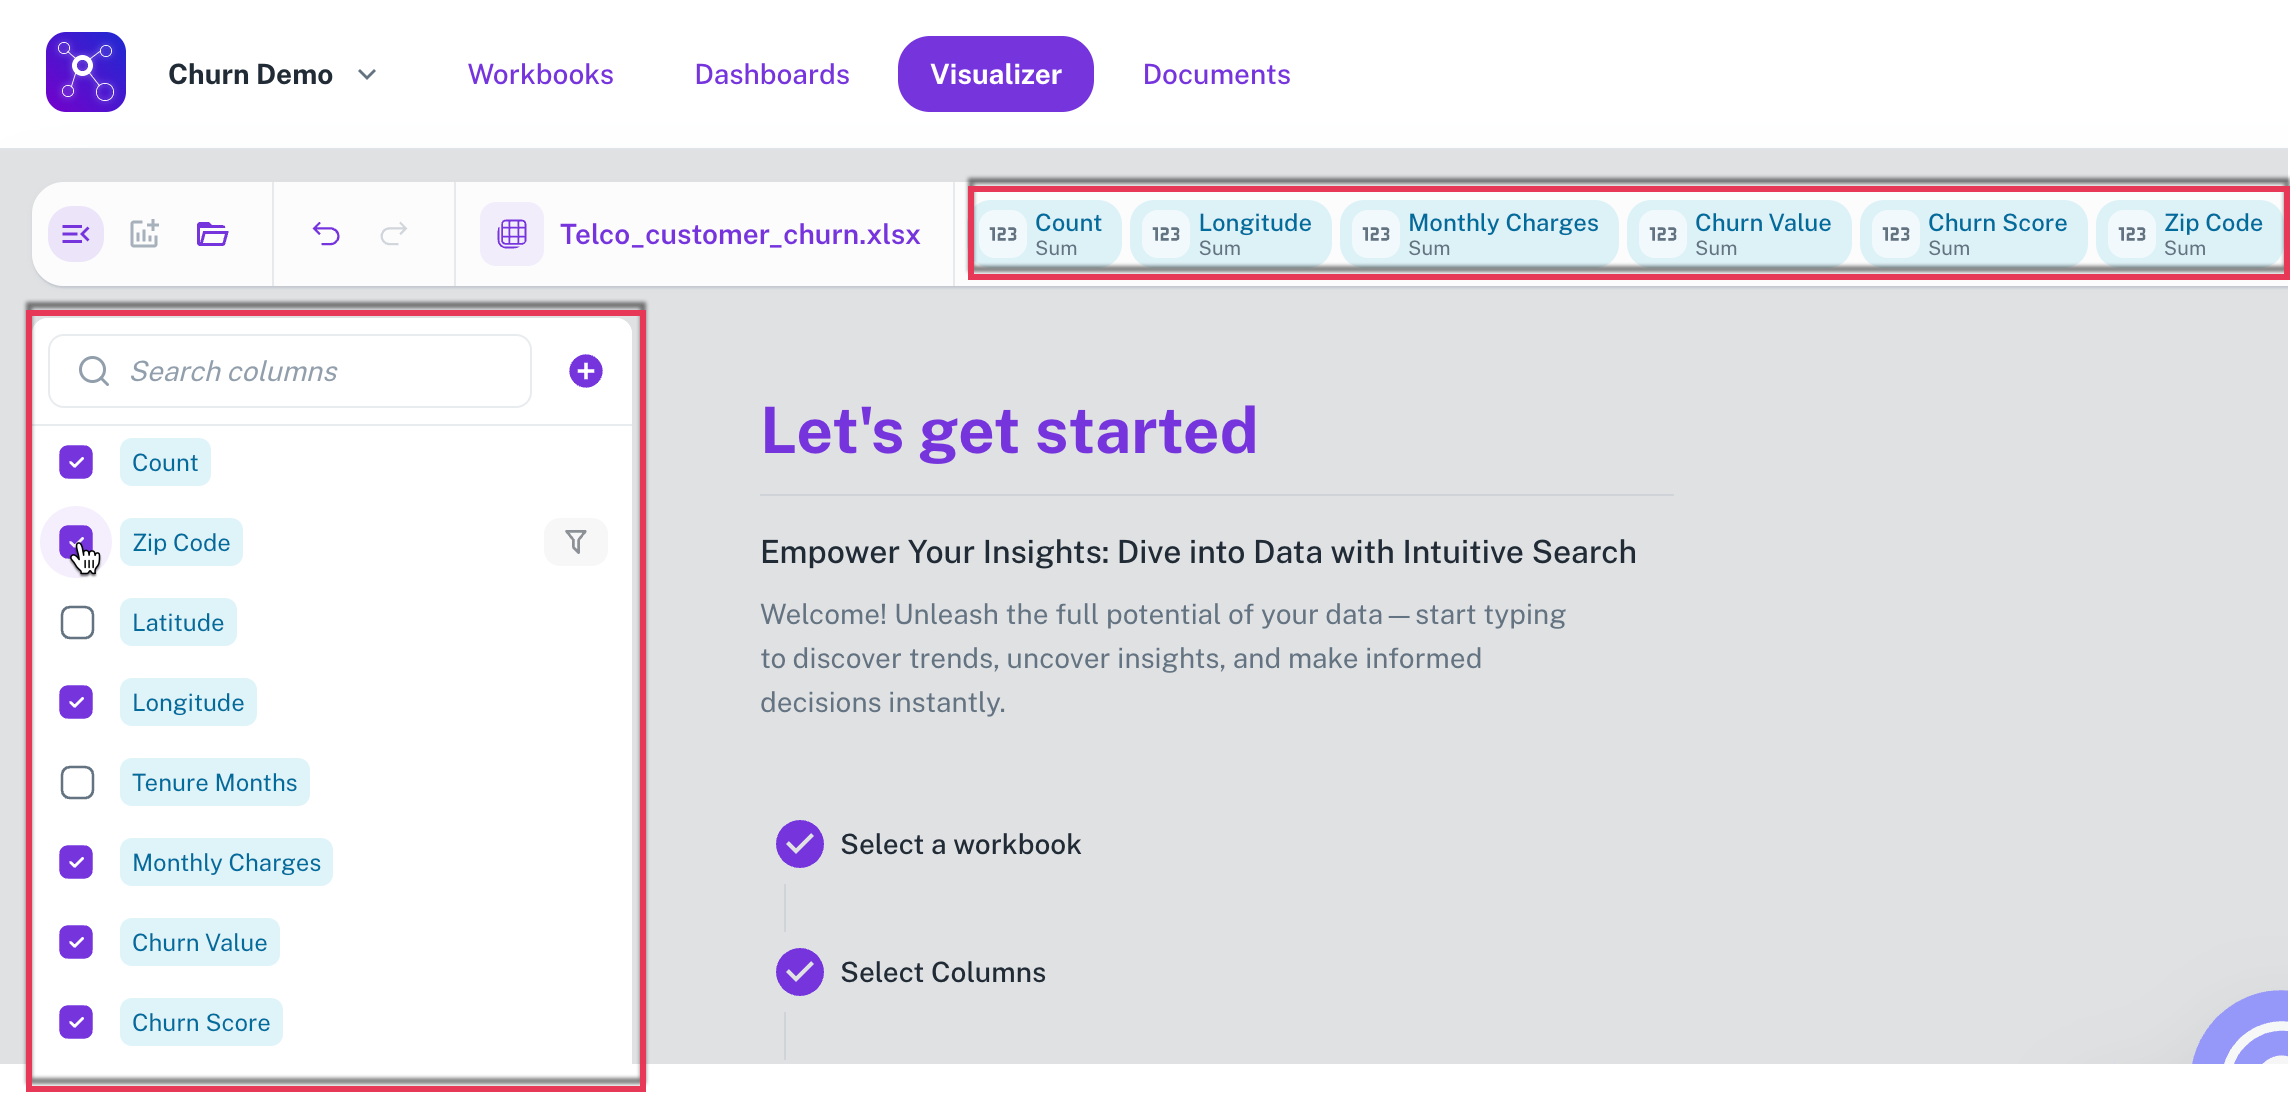
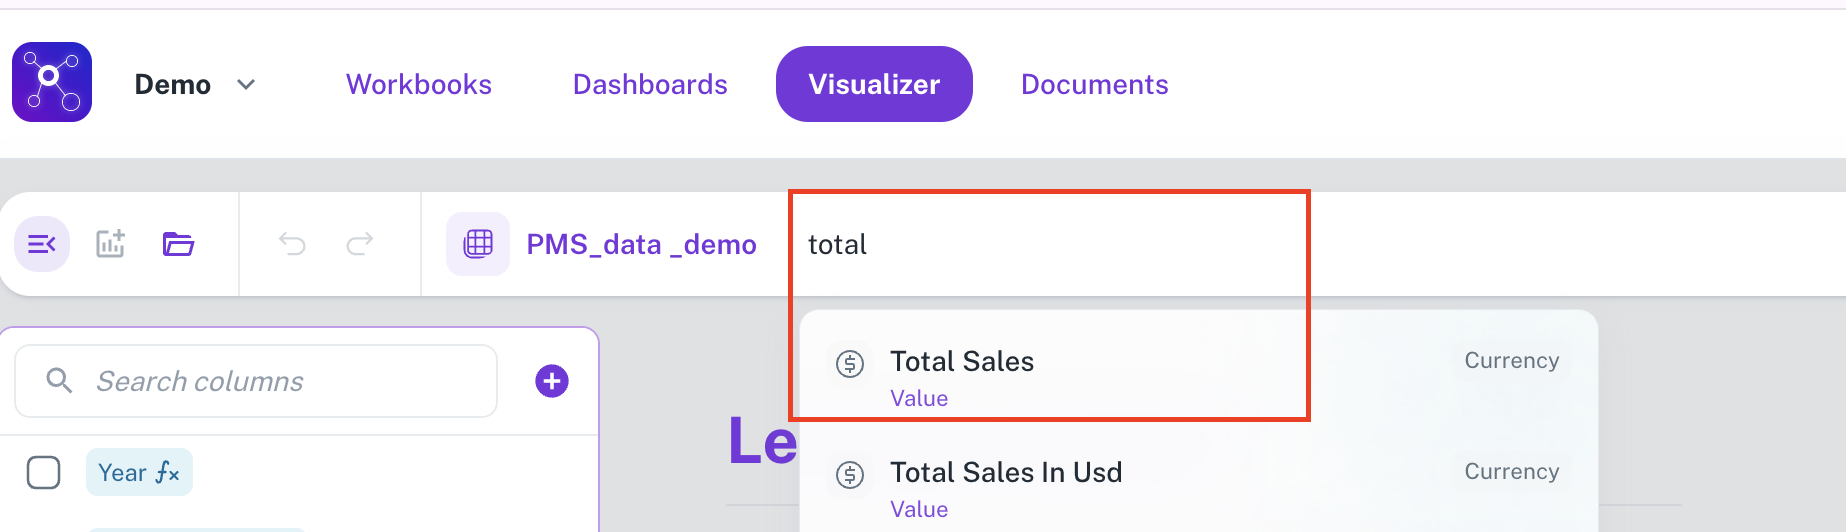
Another method to select columns is by typing the column name on the search bar, this displays a drop-down menu on the corresponding columns in auto complete mode.
The columns are listed with color codes:
-
Blue: These columns contain numerical data that can be aggregated by summing their values.
-
Purple: These columns contain data, either numerical or textual, that are not suitable for summation or similar mathematical aggregation.

-
Grey: These columns contain date and time-based data.

For more details refer to selecting columns.
-
-
From the upper right side, choose the appropriate aggregation functions for each columns. Refer to Aggregate functions
-
Click Create Now or from top, click Generate. The most appropriate visualization widget for your selected data is displayed on the canvas.
-
From the right of the page you have multiple edit options.
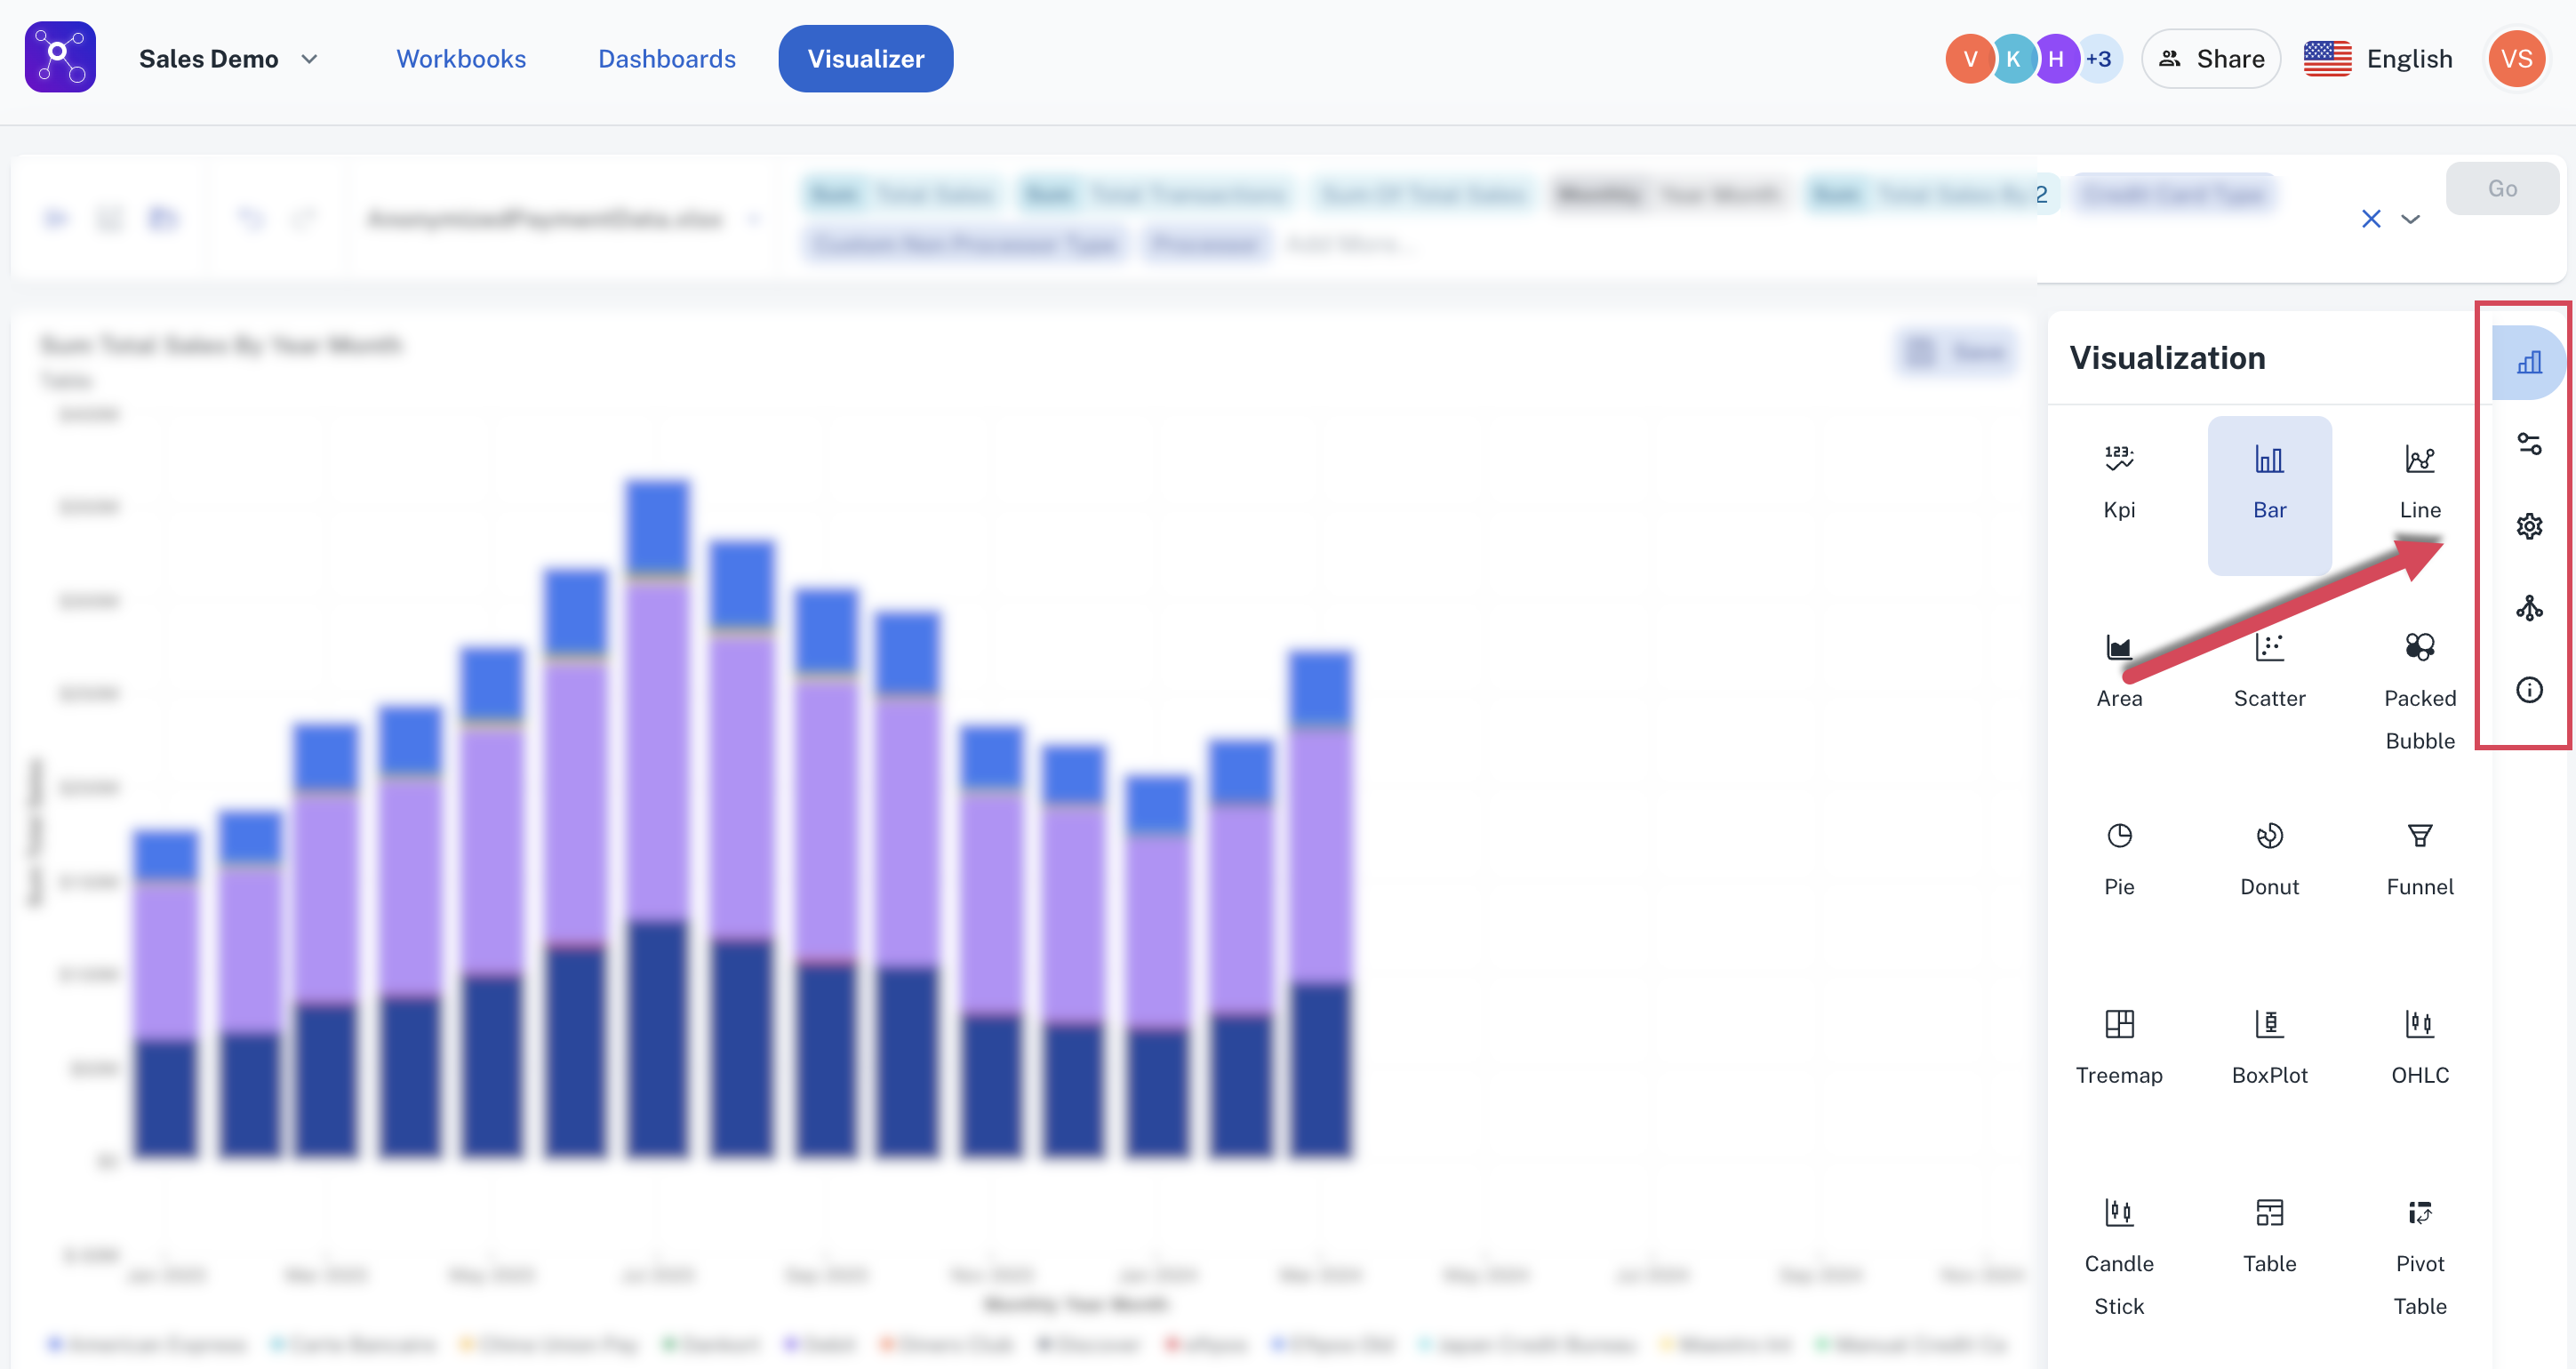
Click any of the following icons to:
-
Change the visualization/widget type. Click the Change Visualization/ Widget type icon to get this done.
-
Edit the configurations of the current widget. To do this click the Update Widget Column Configurations icon.

-
Edit the settings of the current widget. To do this click the Update Settings icon.

-
Choose drill down options to drill down the data. To do this click the Drill Down icon. Refer to creating a dashboard.
-
View SQL query of the data visualization details. To do this, click the View Data Details icon. Refer Viewing the Data Details panel

-
-
Ensure to save the widget to a dashboard. Refer to creating a dashboard.
Was this helpful?